Reports
With the help of the Reports feature, you can generate reports for the needed period of time and view your costs, taxes and profits / losses.
How to search Reports
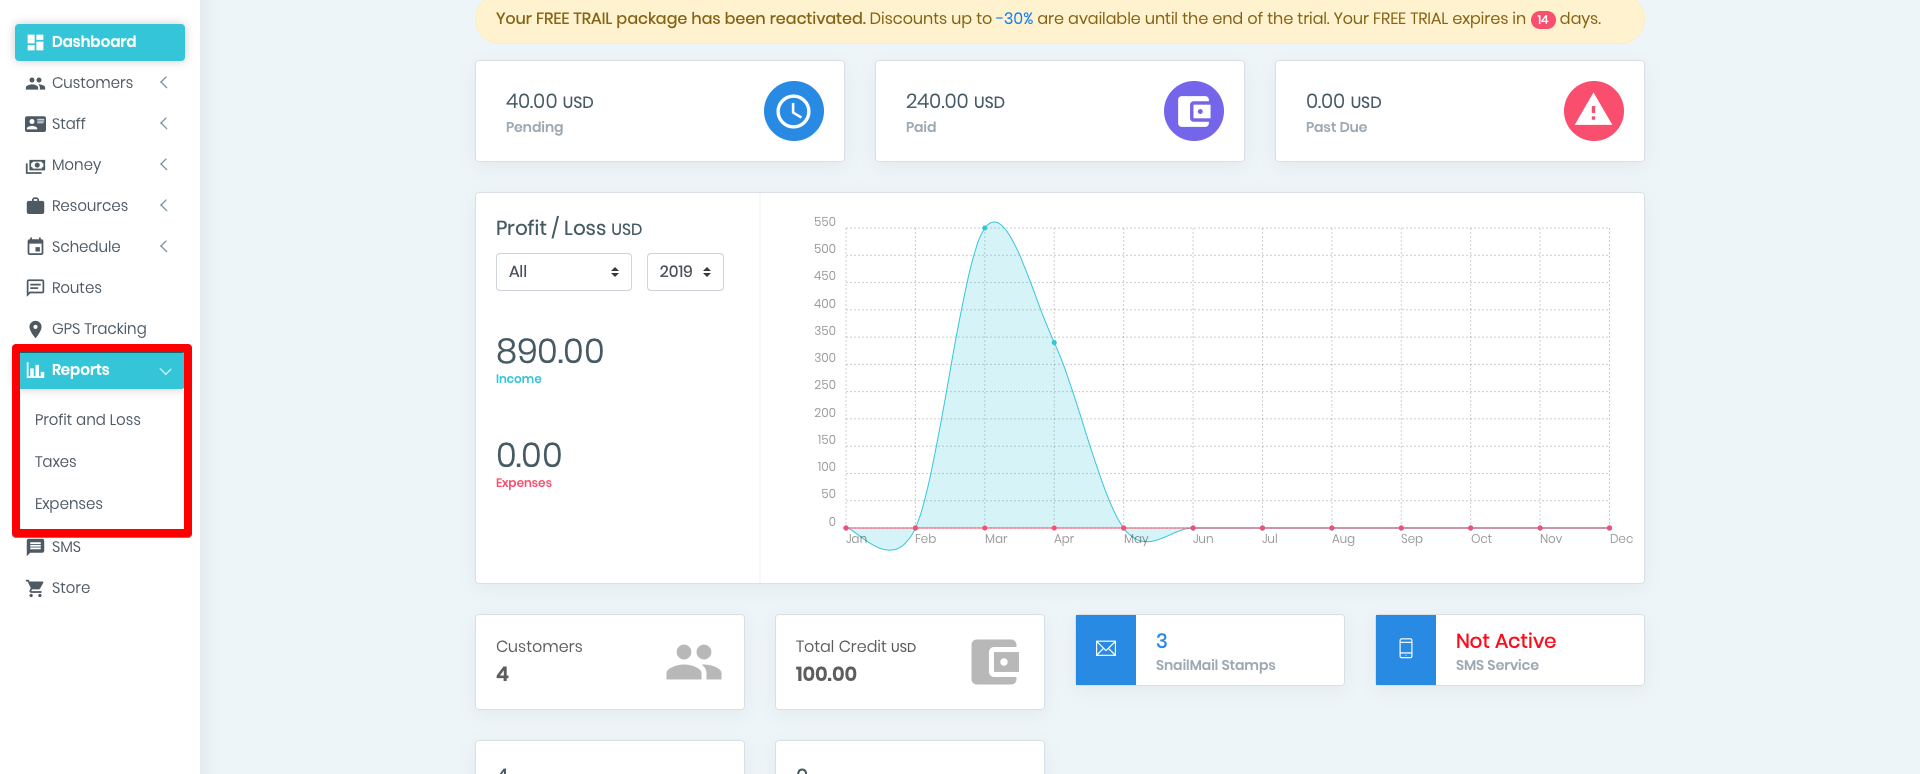
To get to the Reports you need to click on the “Reports” menu item on the left side navigation bar.
Clicking here will open 3 submenu buttons:
- Profit and Loss
- Taxes
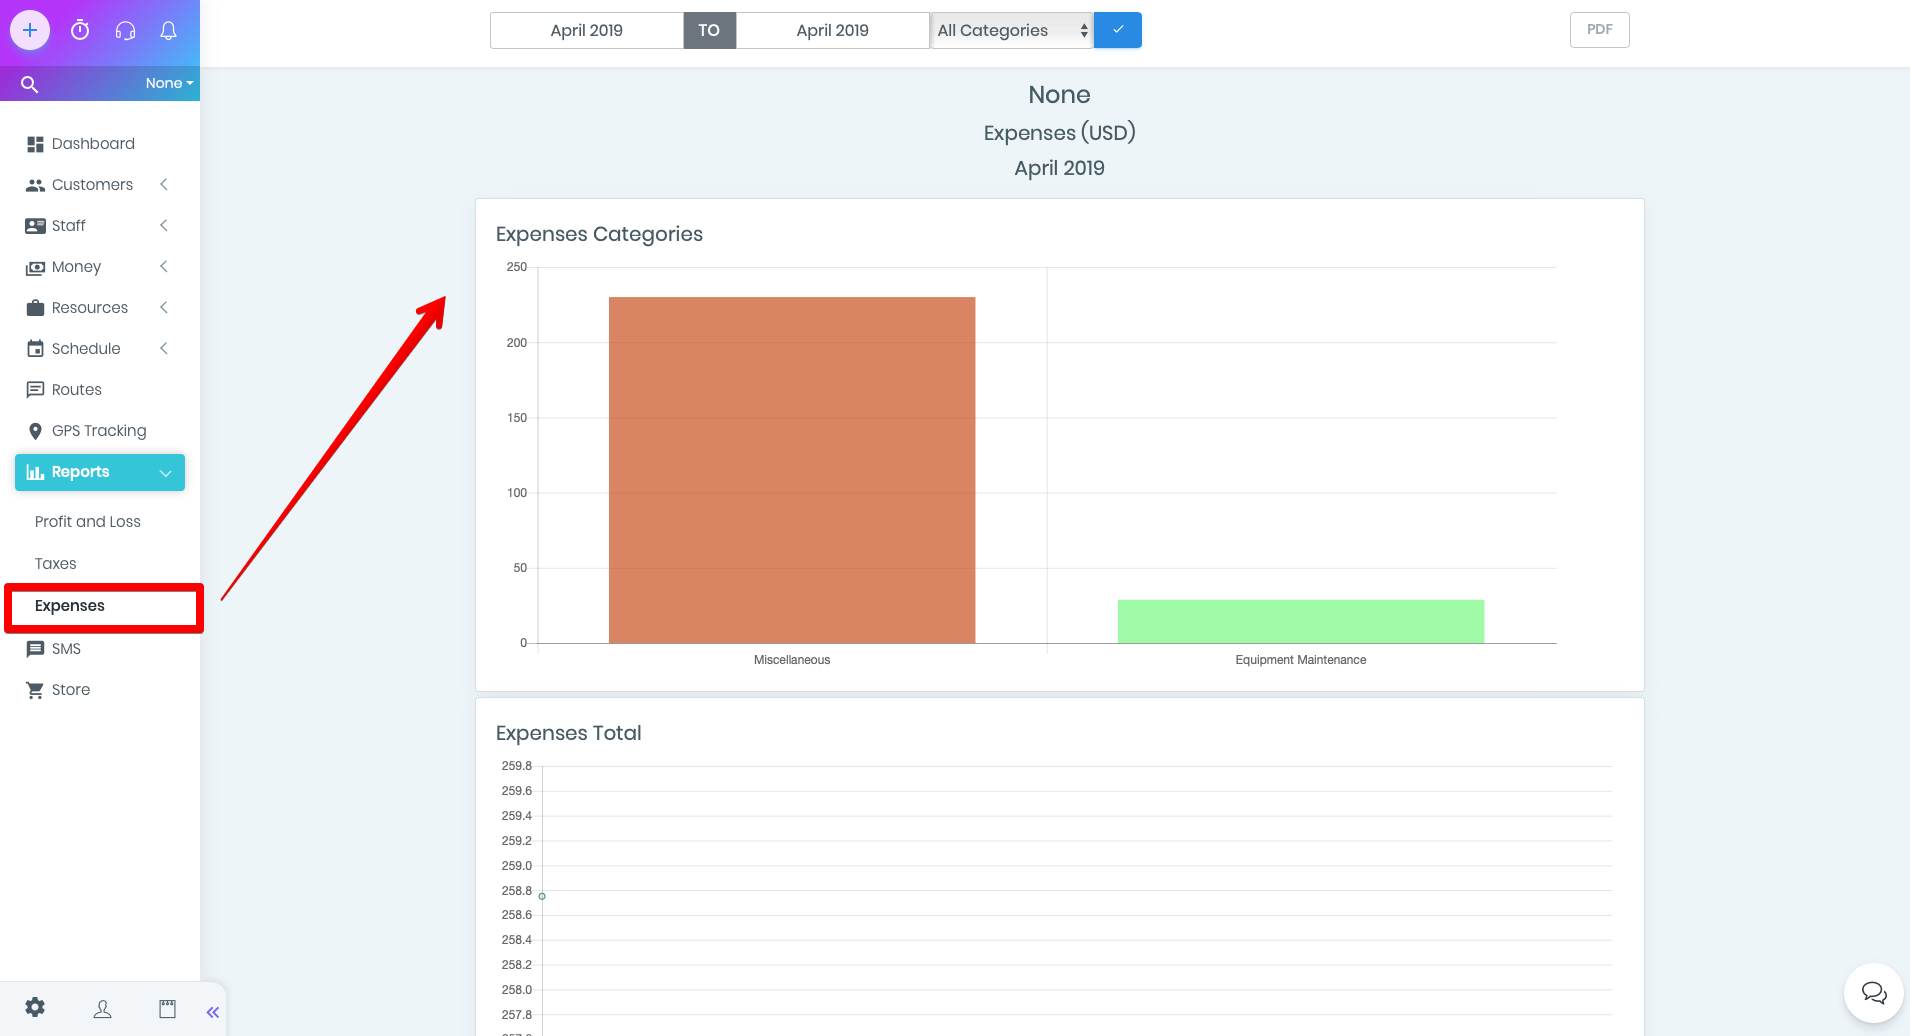
- Expenses
Profit and Loss
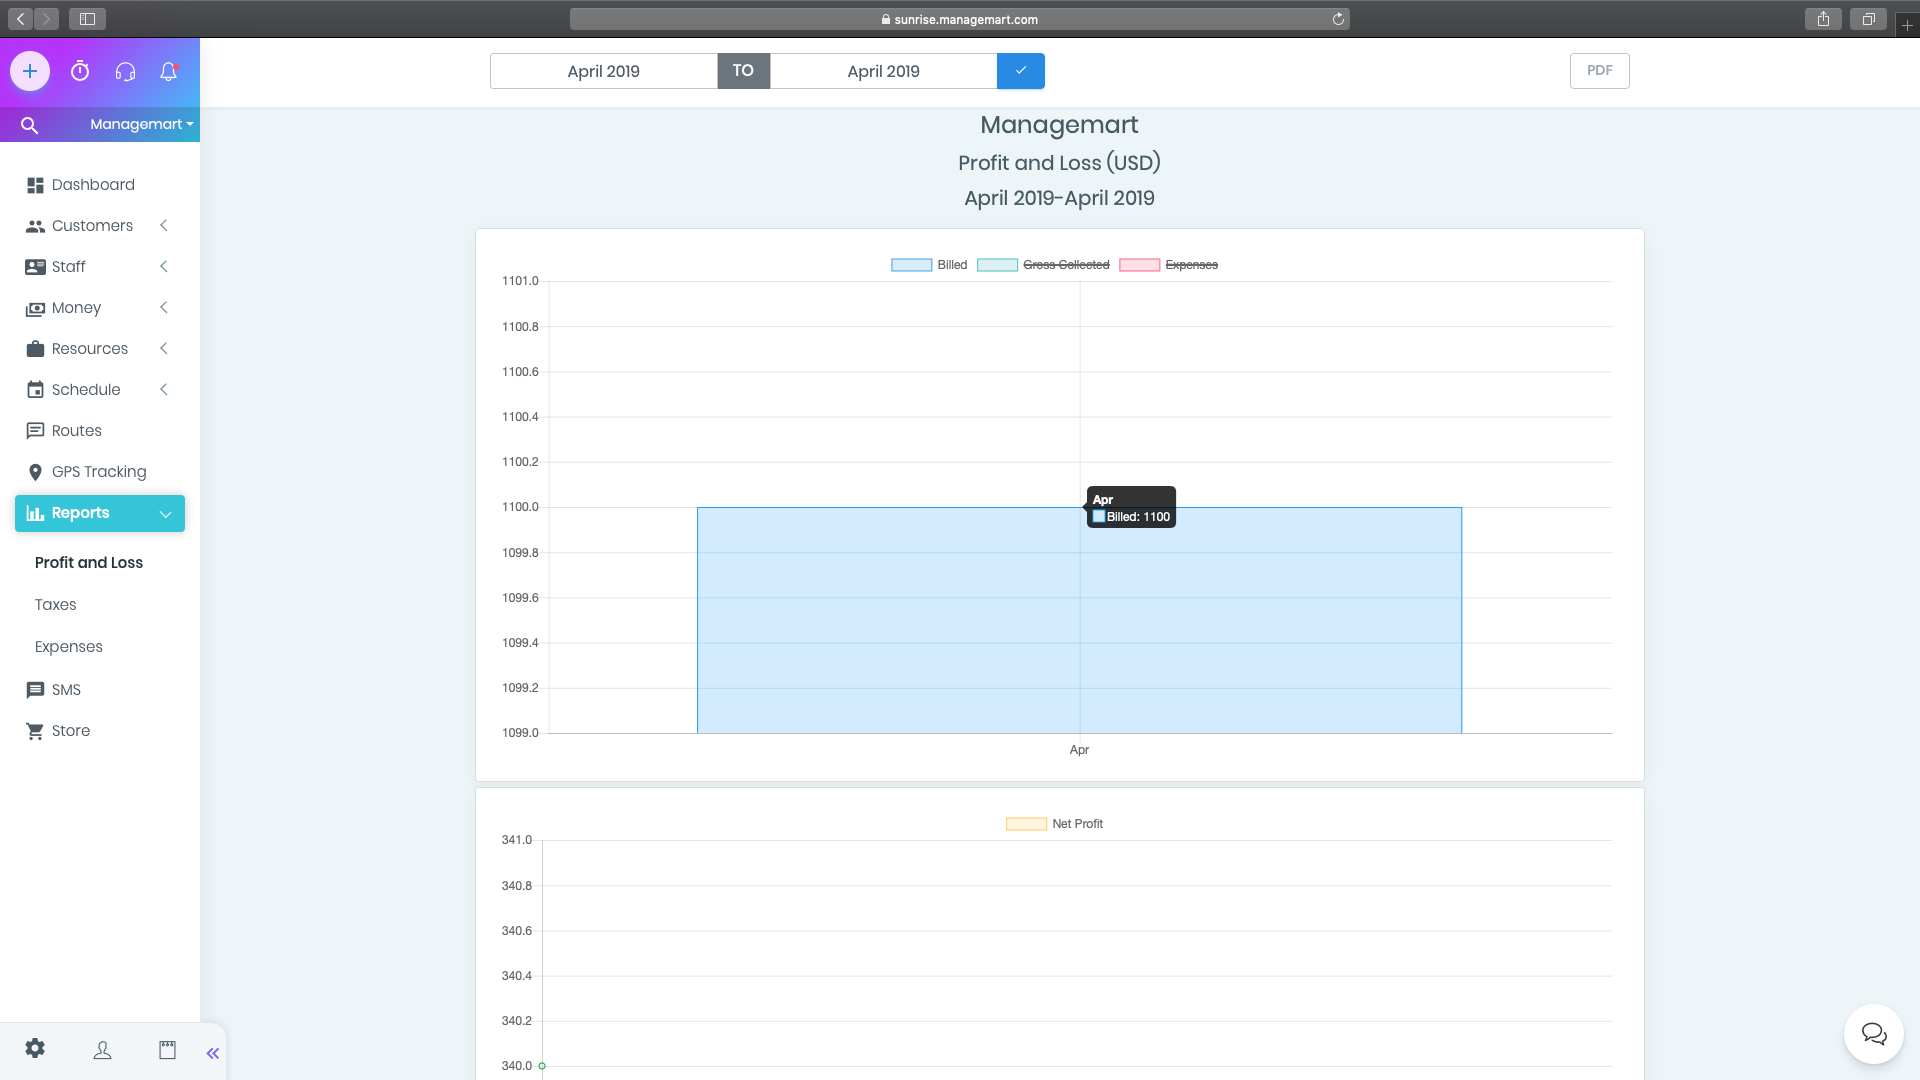
At the very top of the Profit and Loss page you can select the reporting period by setting the needed date. The report is formed by months. After setting the desired time interval, click on the blue button with a check mark, and the data will be presented in the graphs below.
In the right-hand corner of the page there is a button to save the report in PDF format. By clicking on the button, the report will be automatically loaded.
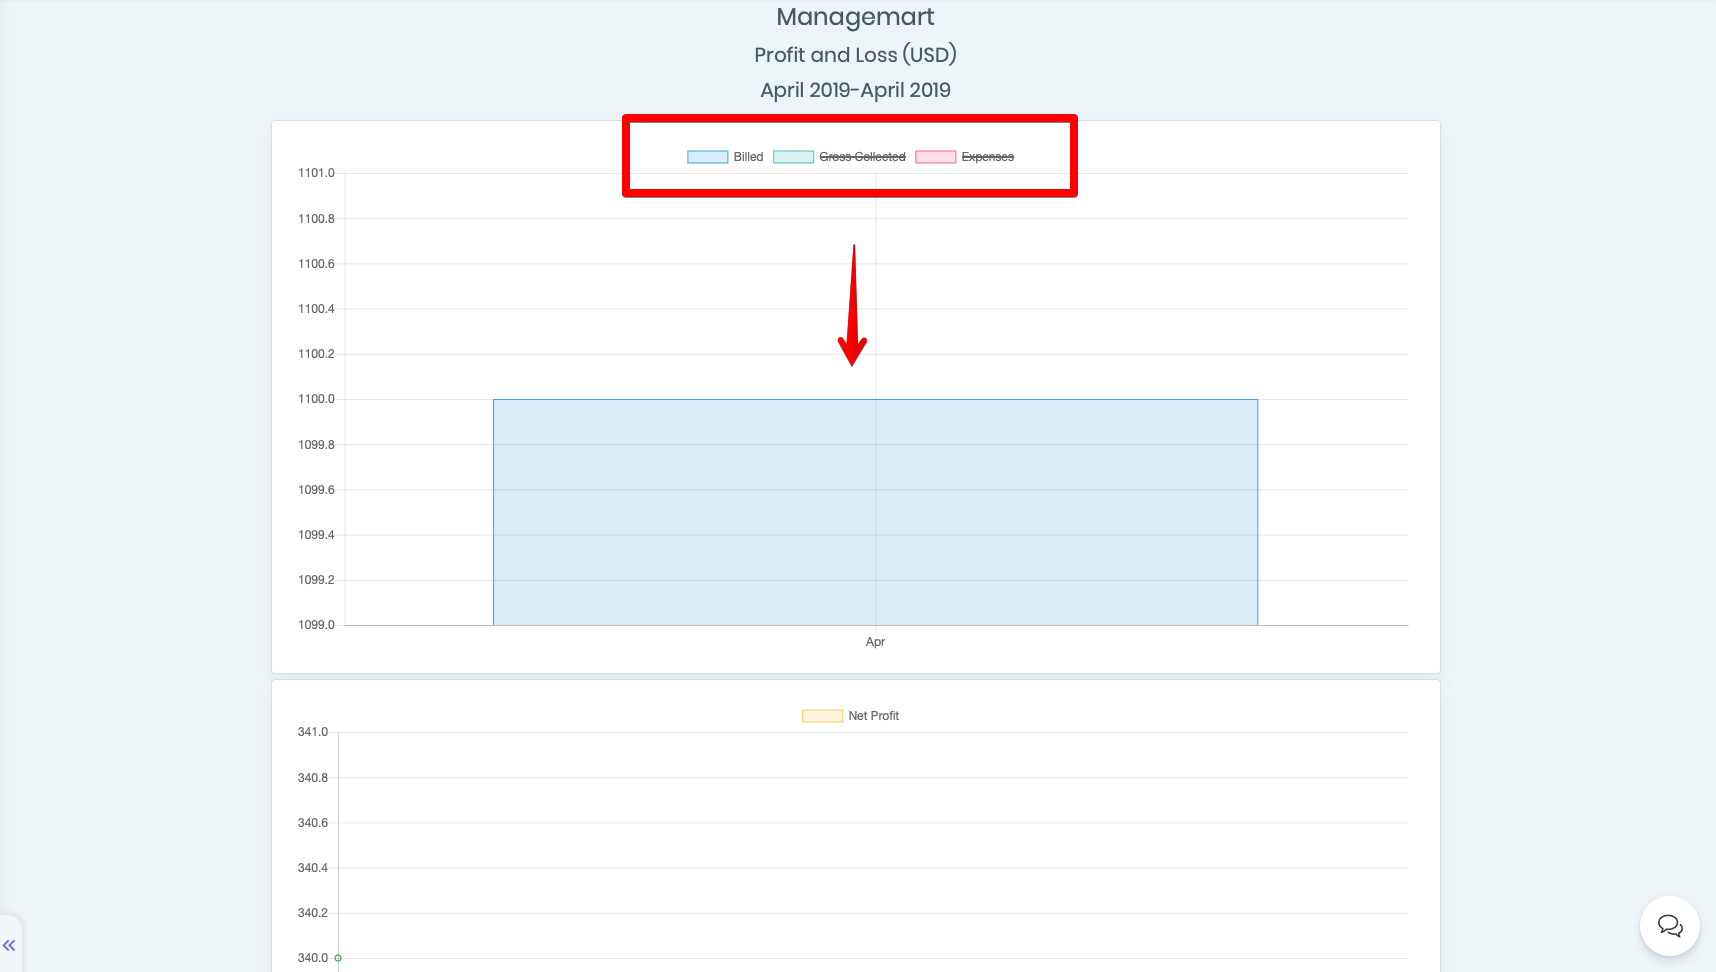
In the title of the graphs is mentioned the name of your company, the reporting period and the type of report in the selected currency. The currency can be changed in the general settings.
Criterias
On the first graph, by default are demonstrated three criterias:
- Billed invoices
- Gross collected of the company
- Company expenses
Horizontally are indicated months, and vertically is indicated the amount from 0 to the maximum, with rounded sum marks depending on the value of the indicator.
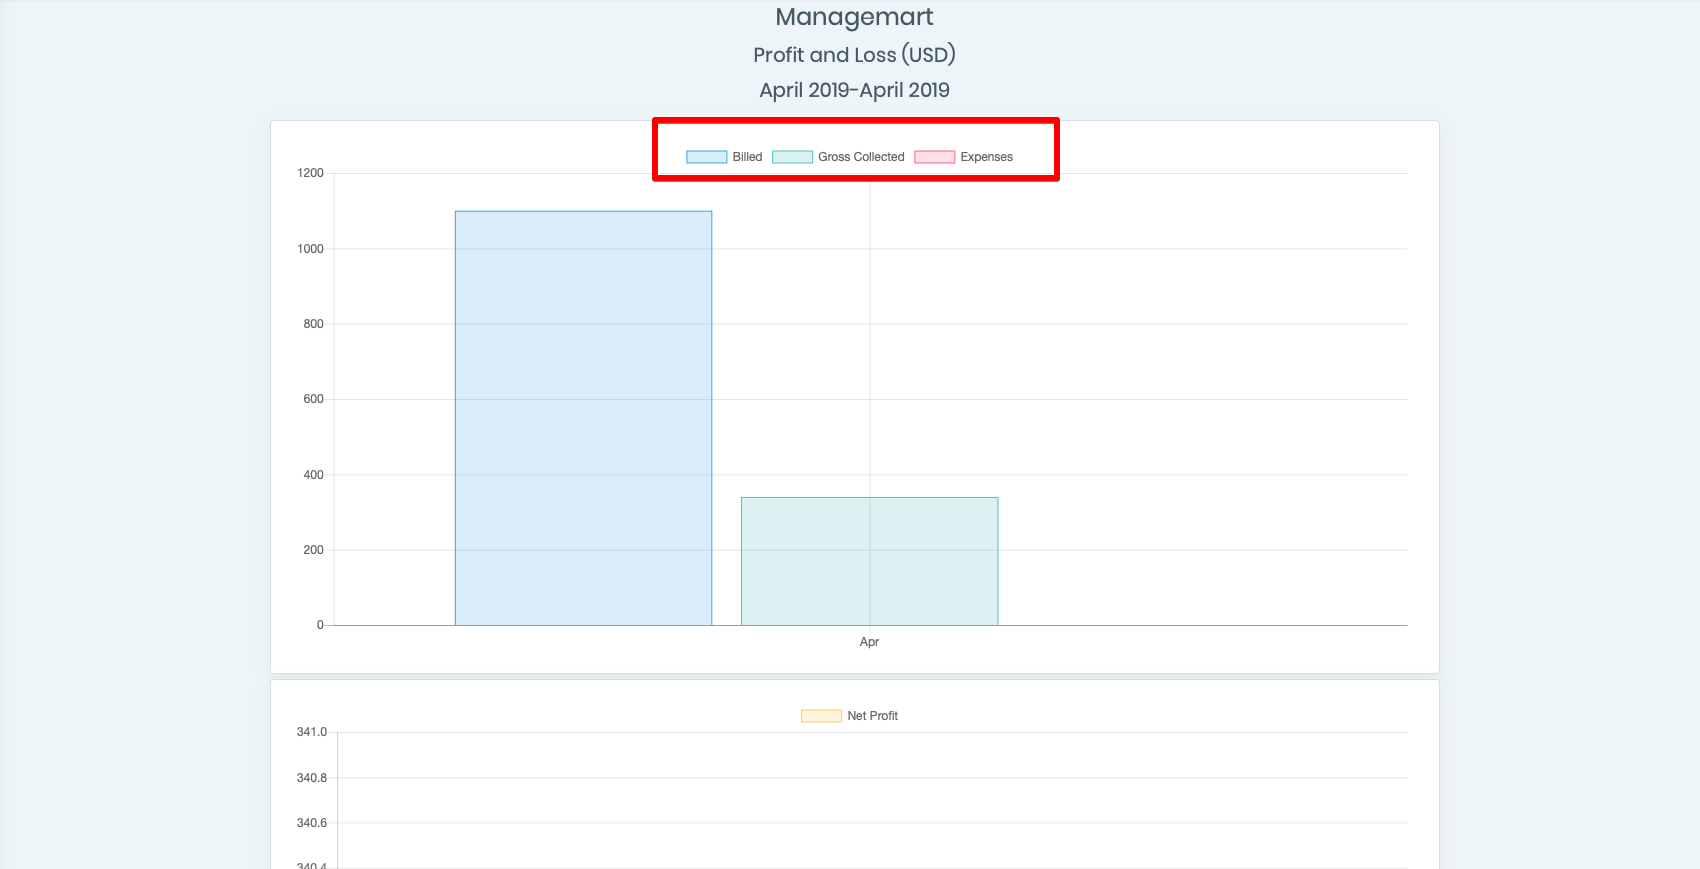
If you want to see data on only one or two parameters on the chart, click on the spare one, and it will be crossed out. Data on these criteria will not be displayed on the graph.
By hovering the cursor over a column of a specific parameter, you can see the exact amount for that period.
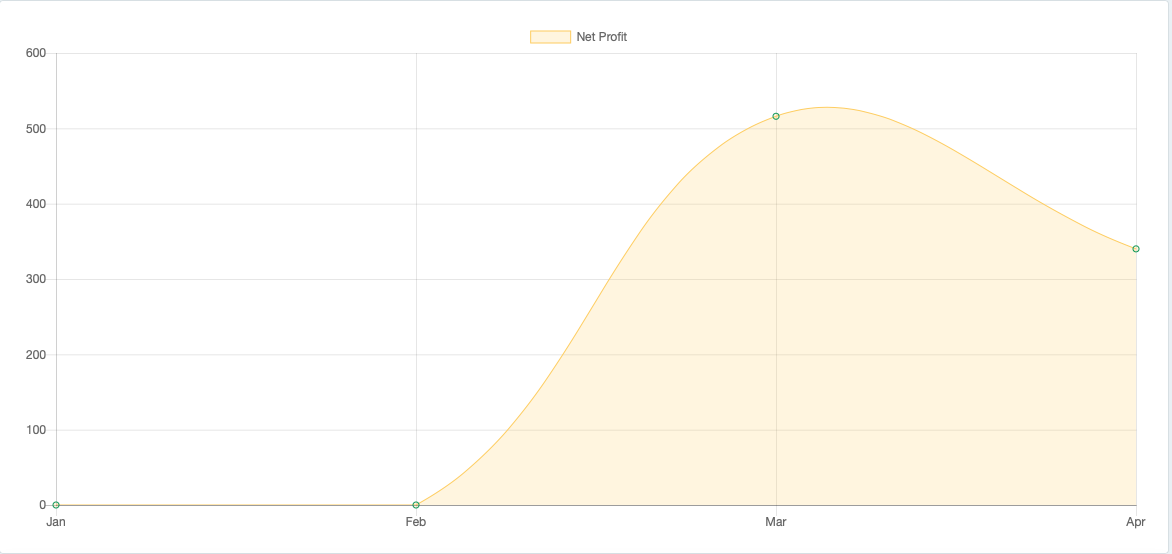
Net Profit Chart
The next graph shows the net profit of your company for the selected period of time.
Horizontally are indicated months, and vertically is indicated the amount from 0 to the maximum net profit.
By hovering on the green points you will see the exact amount of the net profit for the needed period.
The table below the NET PROFIT chart displays data on the total amount in all issued invoices, as well as the number of the issued invoices minus expenses.
The information is displayed by month and cost/profit parameters.
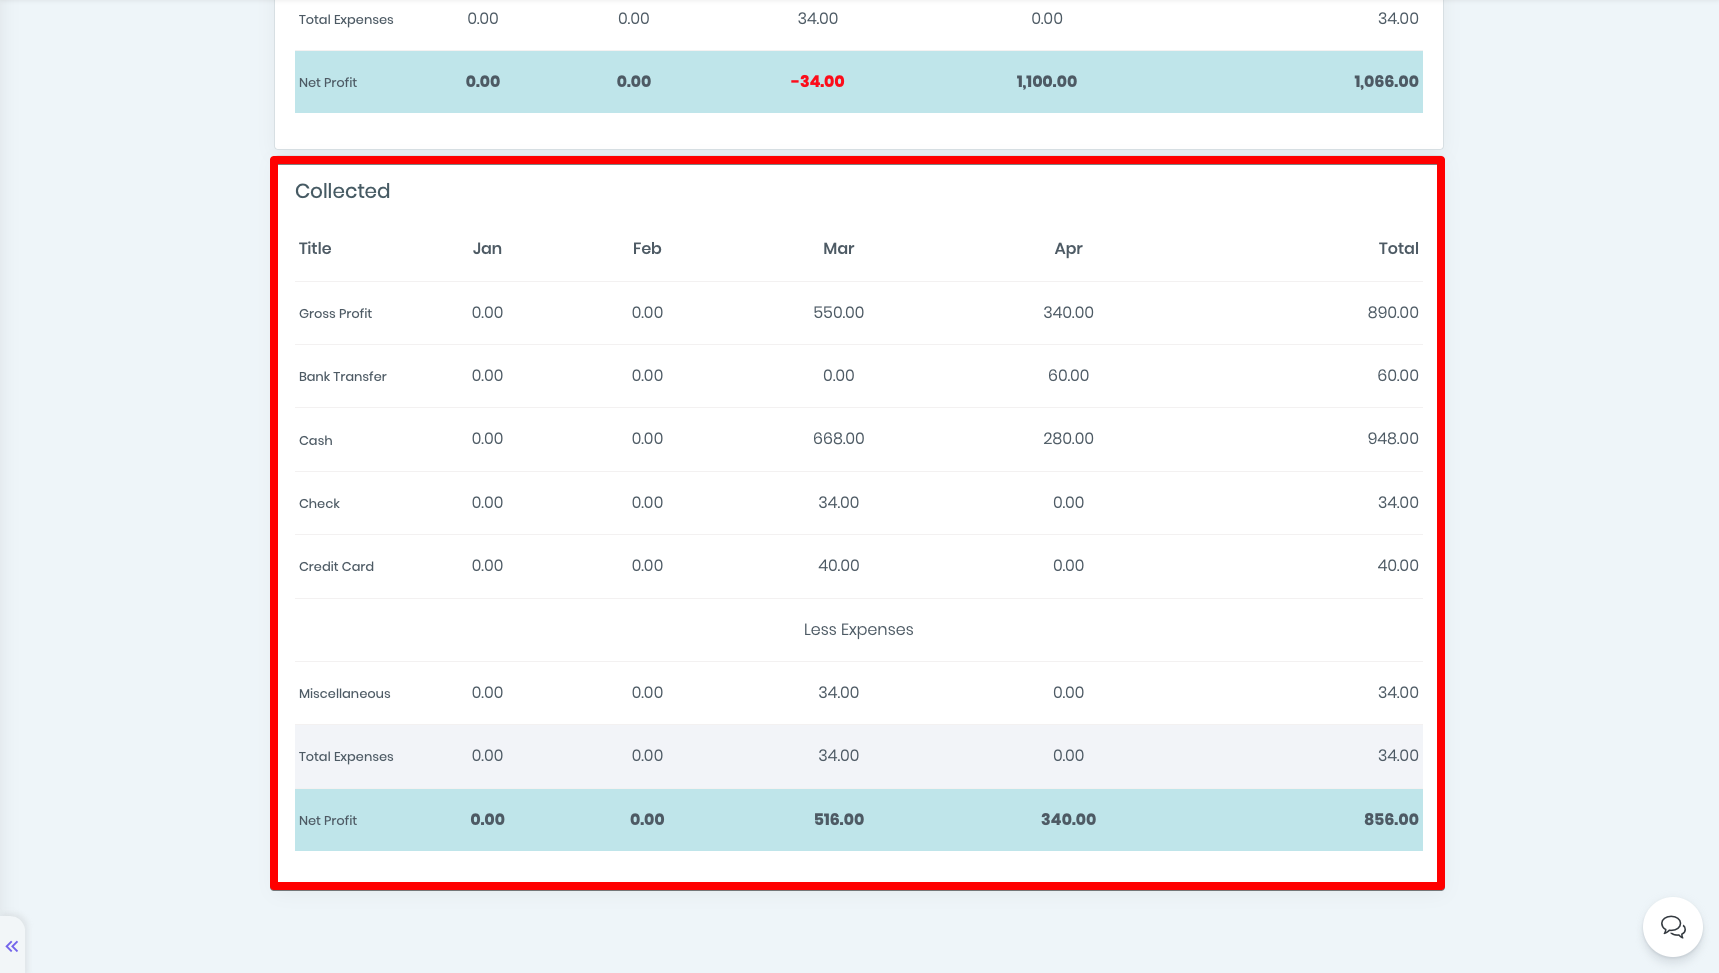
Collected
In the lowest table named Collected, you can see the information about the used payment methods and amounts.
Tax Summary Chart
This page contains all the information about the taxes and has two additional parameters, that include:
- Billed - tax summary of all the invoices
- Collected - tax summary
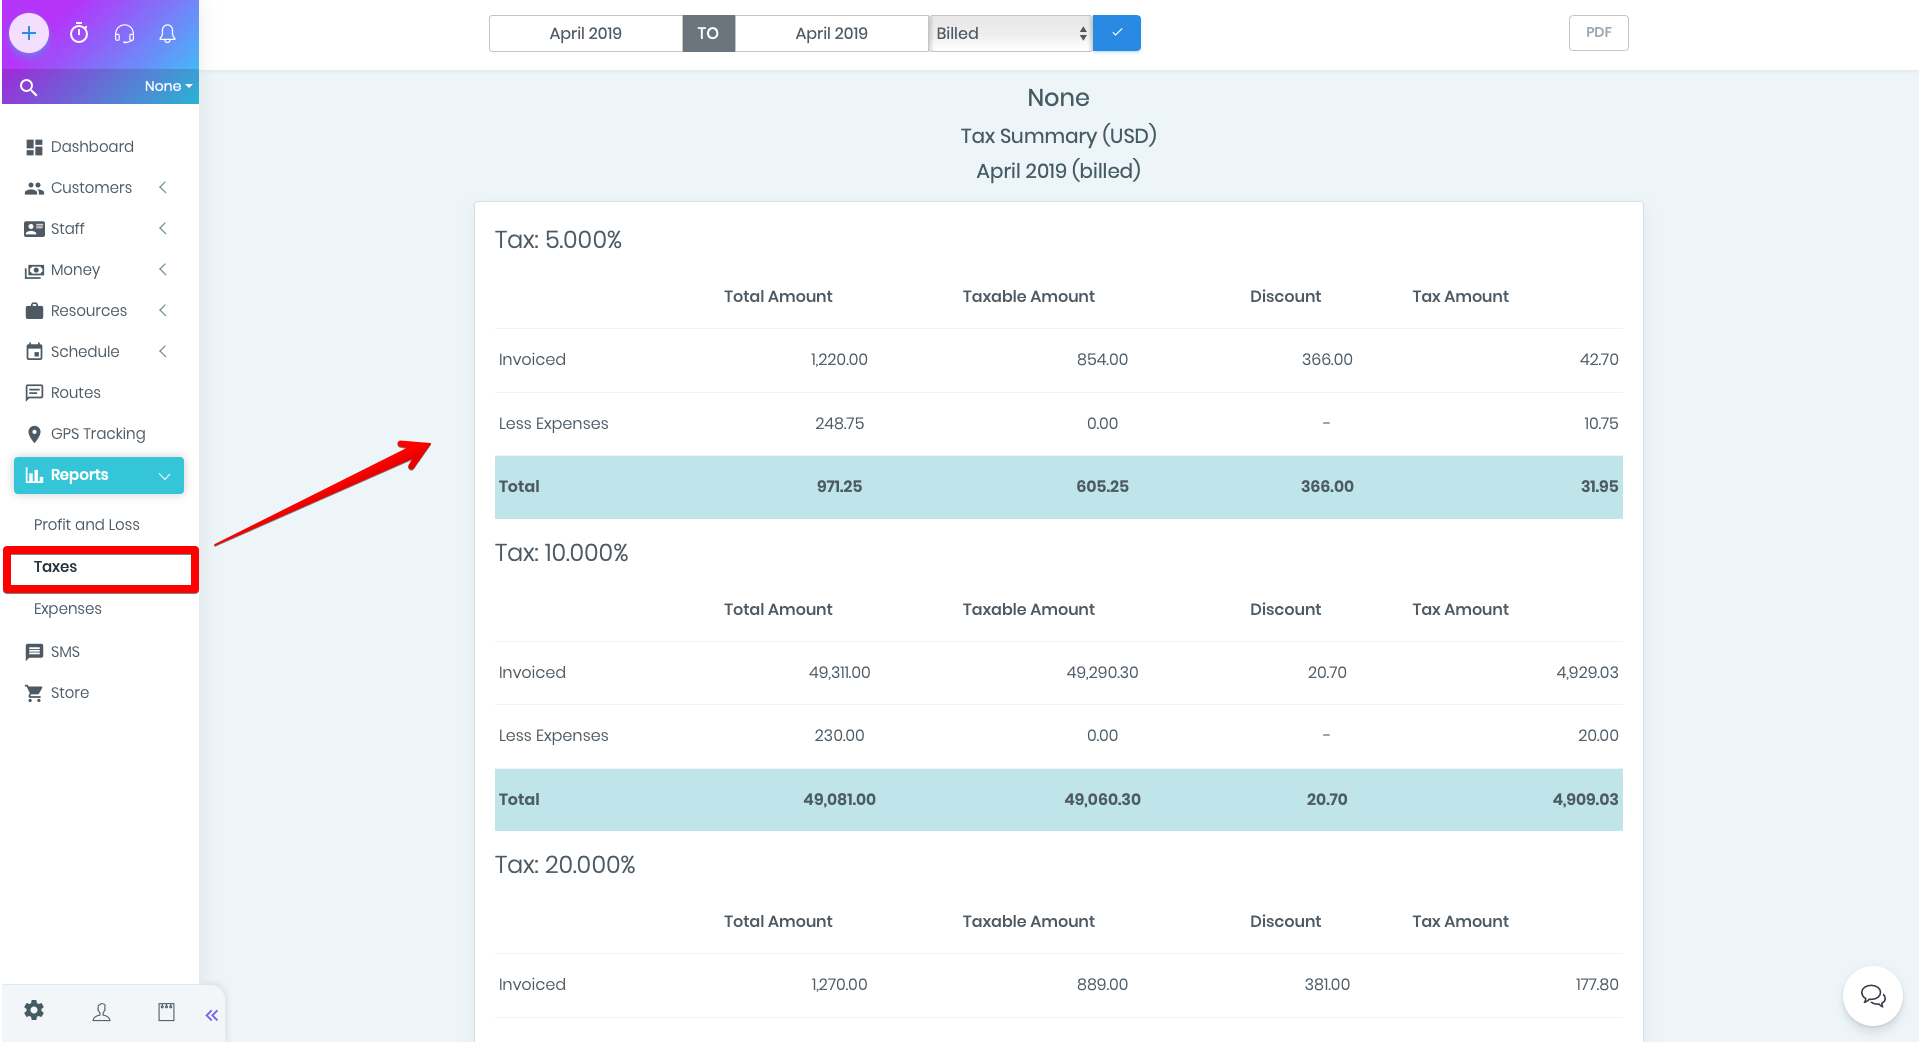
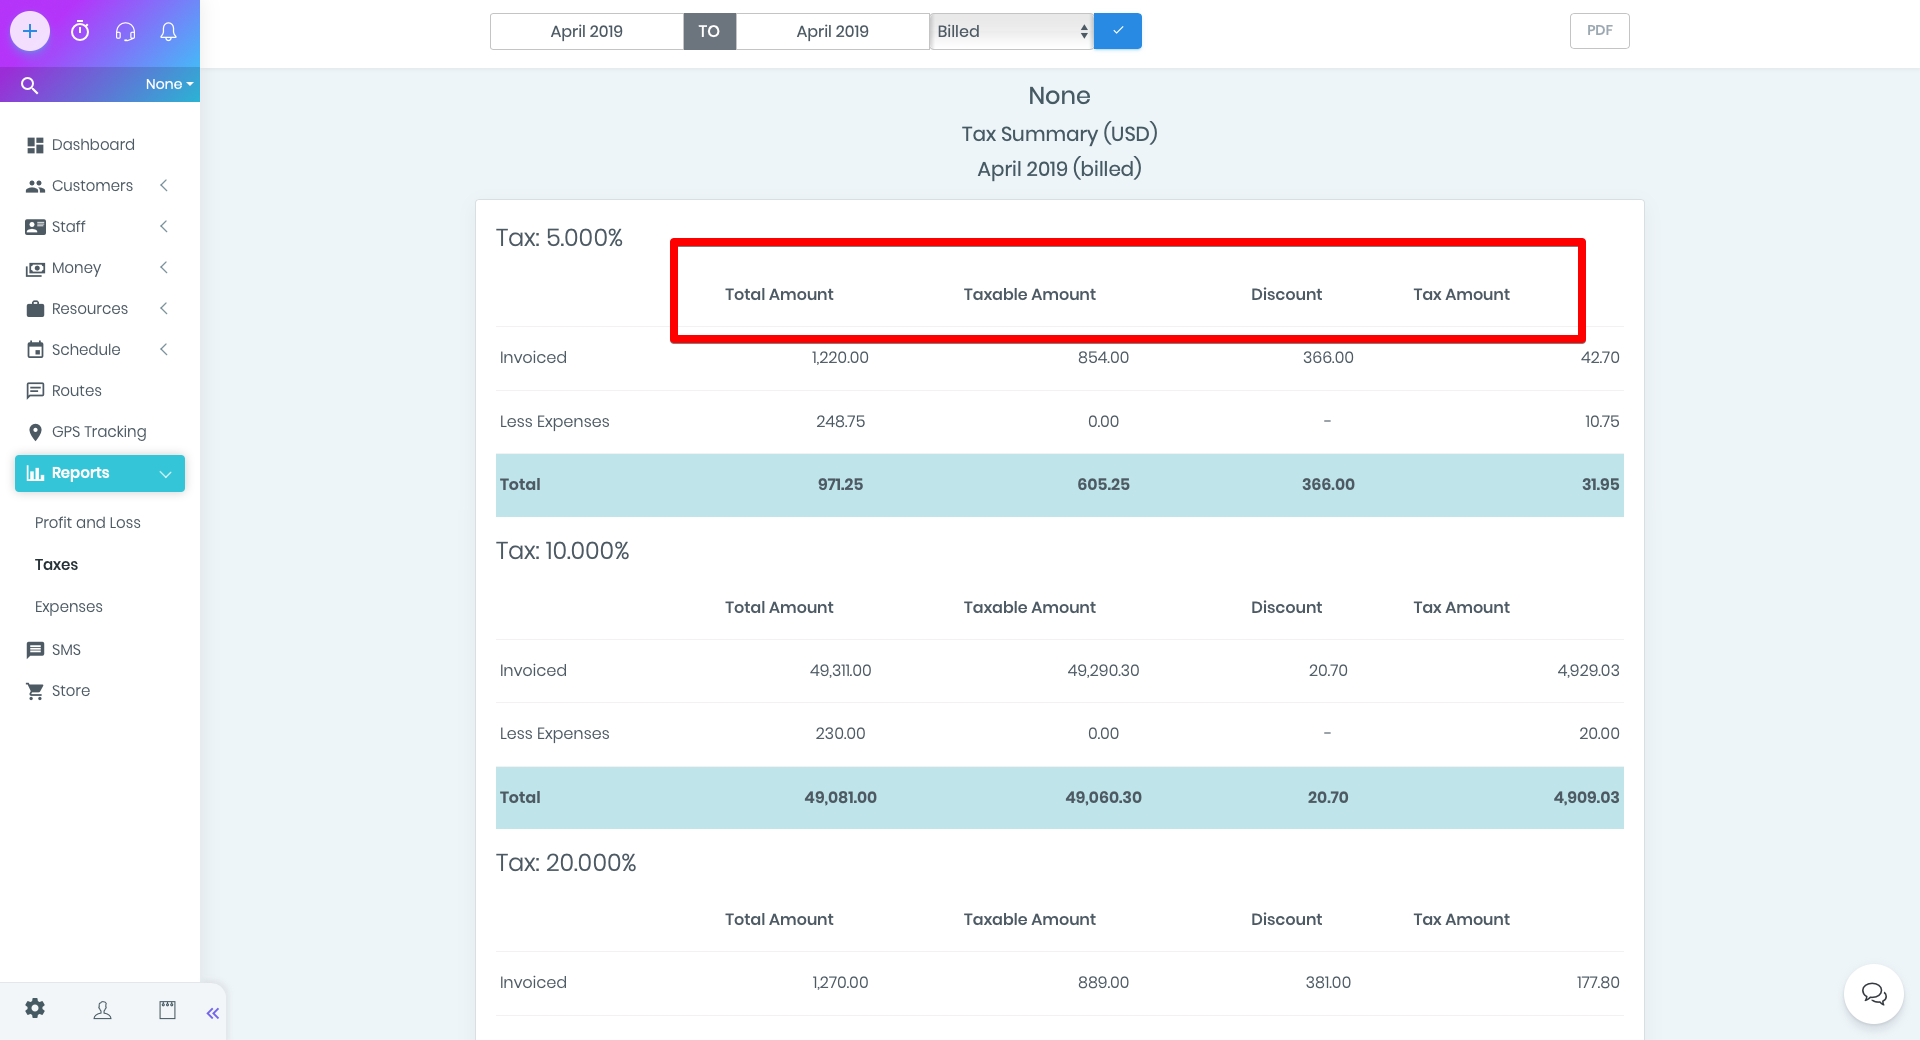
The table demonstrates the total values for the selected period, individually for each tax percentage.
In the columns of the table:
- Total Amount - the total amount of invoices
- Taxable Amount - total invoice amount minus tax deductible
- Discount - the discount percentage
- Tax Amount - the amount of the tax itself
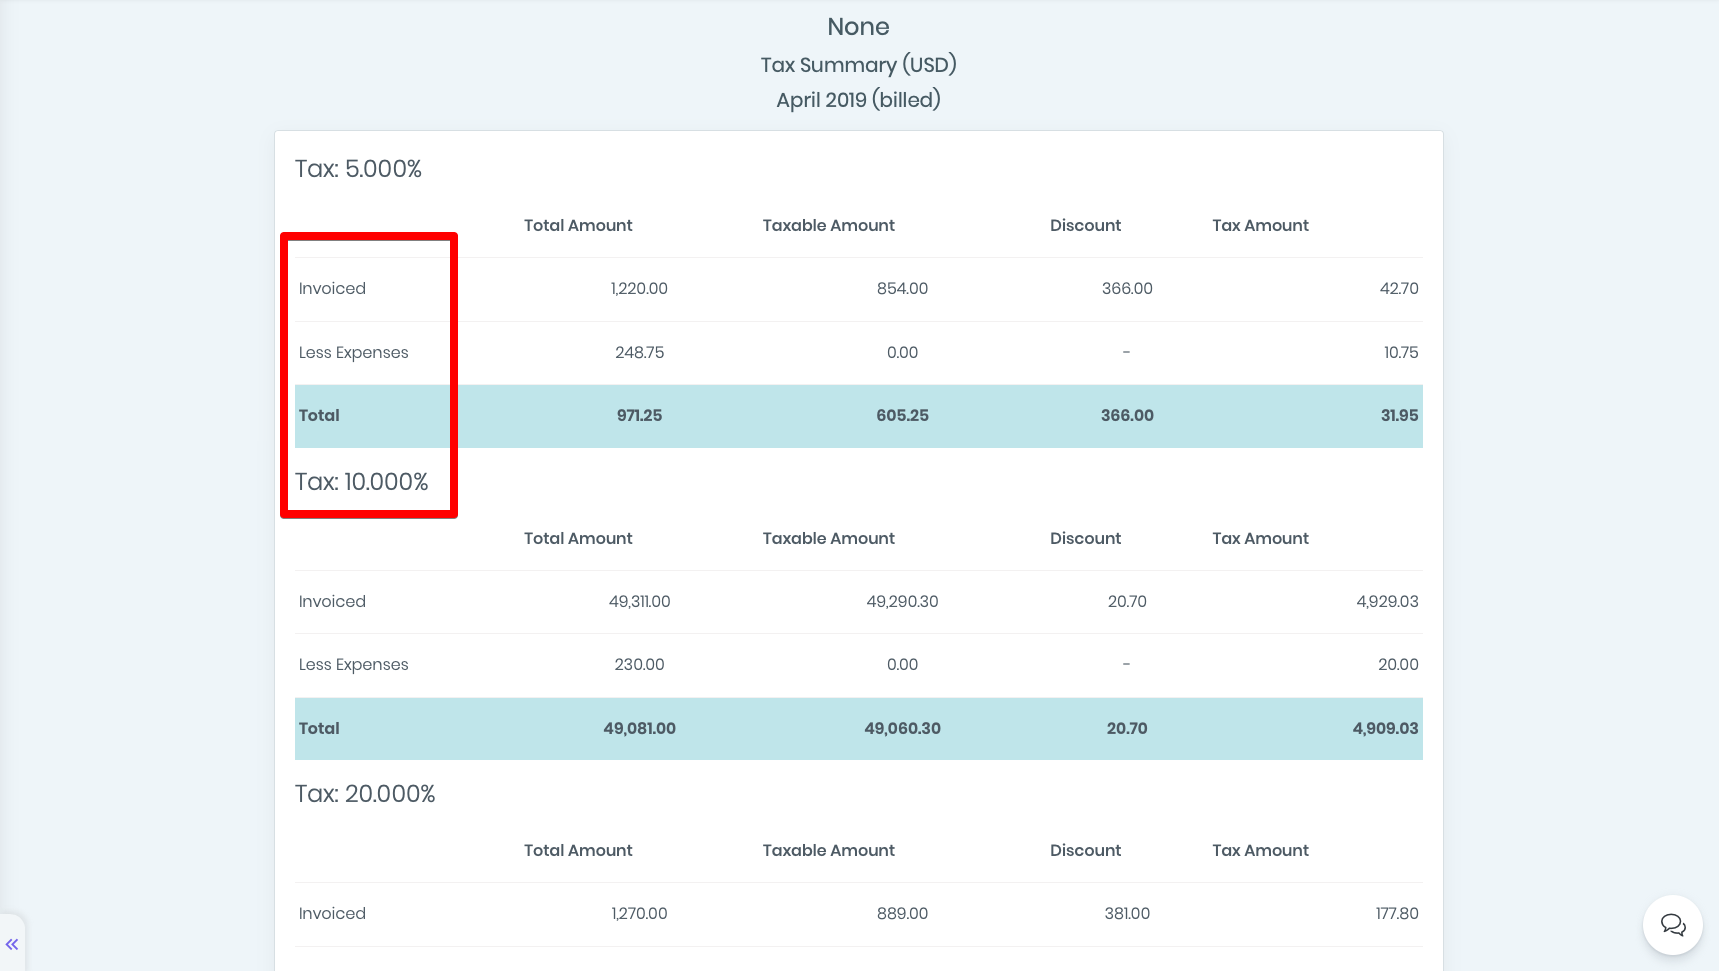
The rows of the table contain the following information:
- Invoiced - invoice amount
- Less Expenses - expenses
- Total - cumulative amounts minus expenses
- Tax Amount - the amount of the tax itself
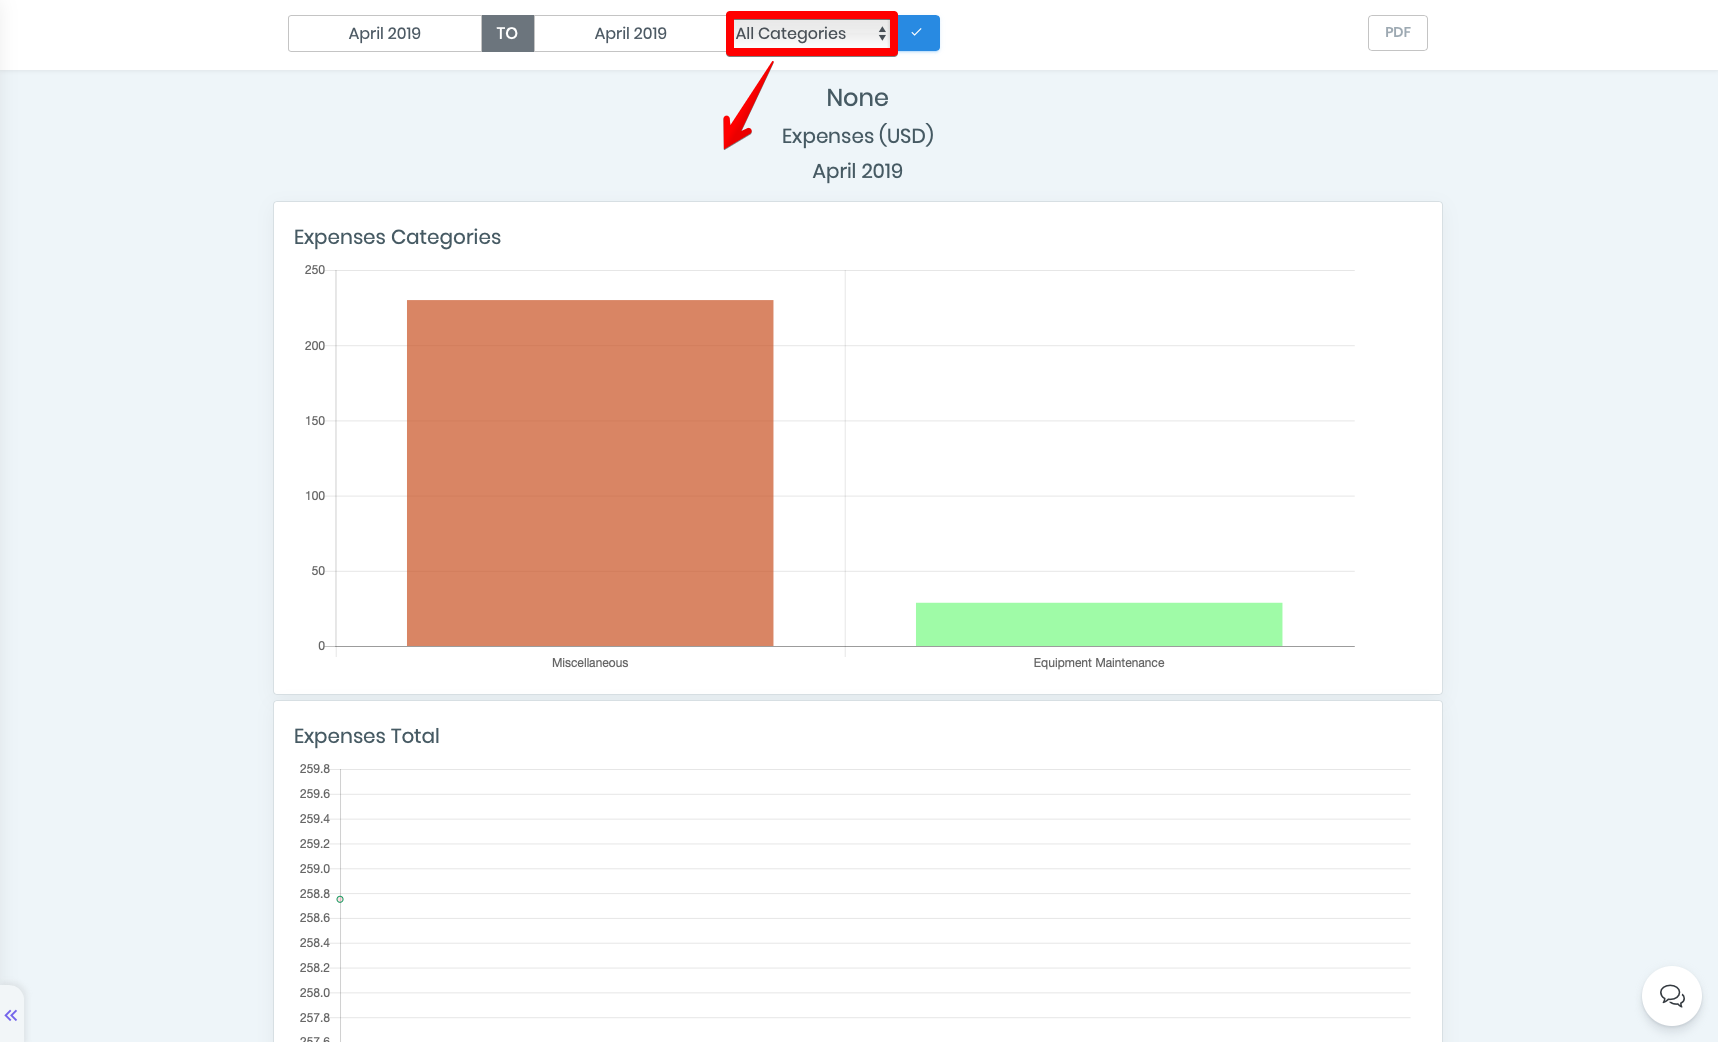
Here you can find two additional parameters, besides the time period, which are:
- All categories - a summary of all costs
- Equipment Maintenance - a separate summary of equipment maintenance costs
- Miscellaneous - a summary of other expenses.
All categories filter
By selecting the All categories filter, you will see a page with data in graphs and tables.
- Expenses Categories - the first table, which contains cost categories and amounts;
- Expenses Total - total expenses by months, where you can view the dynamics of changes;
- Equipment Maintenance is a table of equipment maintenance costs. The information is displayed by date, title, taxes, amount and the name of the responsible person for the equipment;
- Miscellaneous - other expenses;
- Expenses Summary - total expenses of the company for the specified period which also includes taxes.
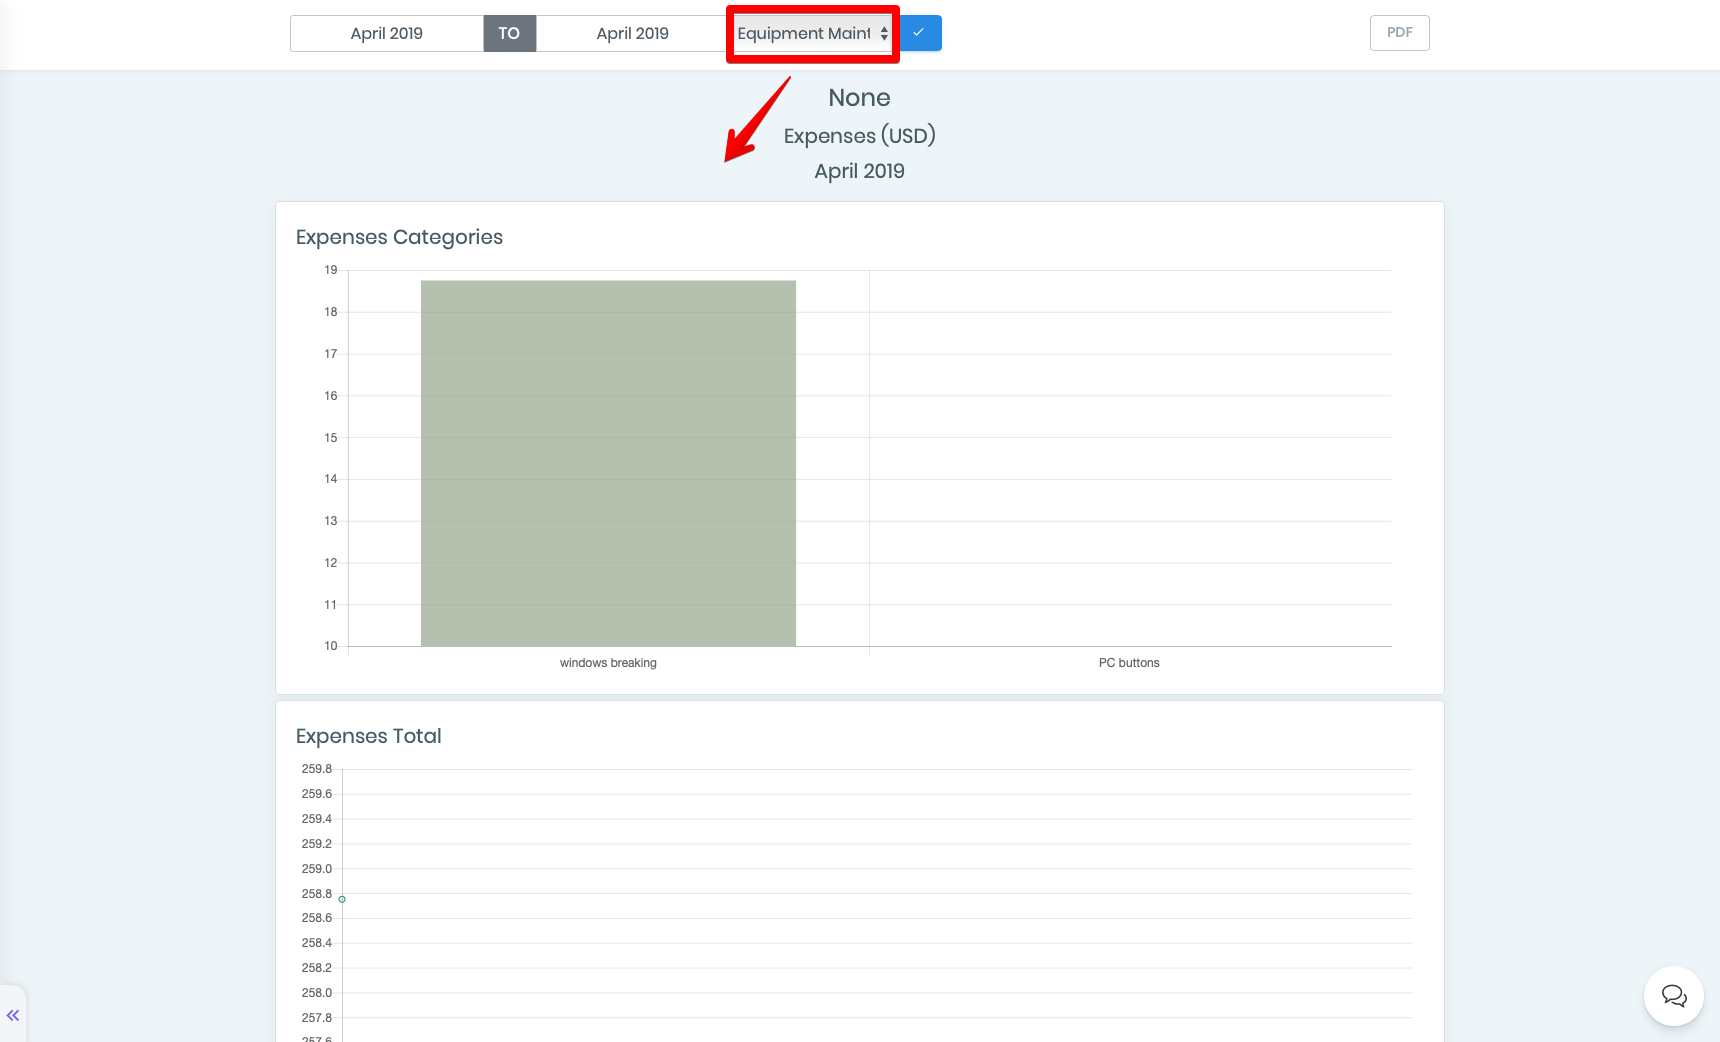
Equipment Maintenance filter
By selecting the Equipment Maintenance filter, you can only see data for this type of cost. Tables and graphs are similar to the first option. Additionally, you can view the name of the equipment and its cost.
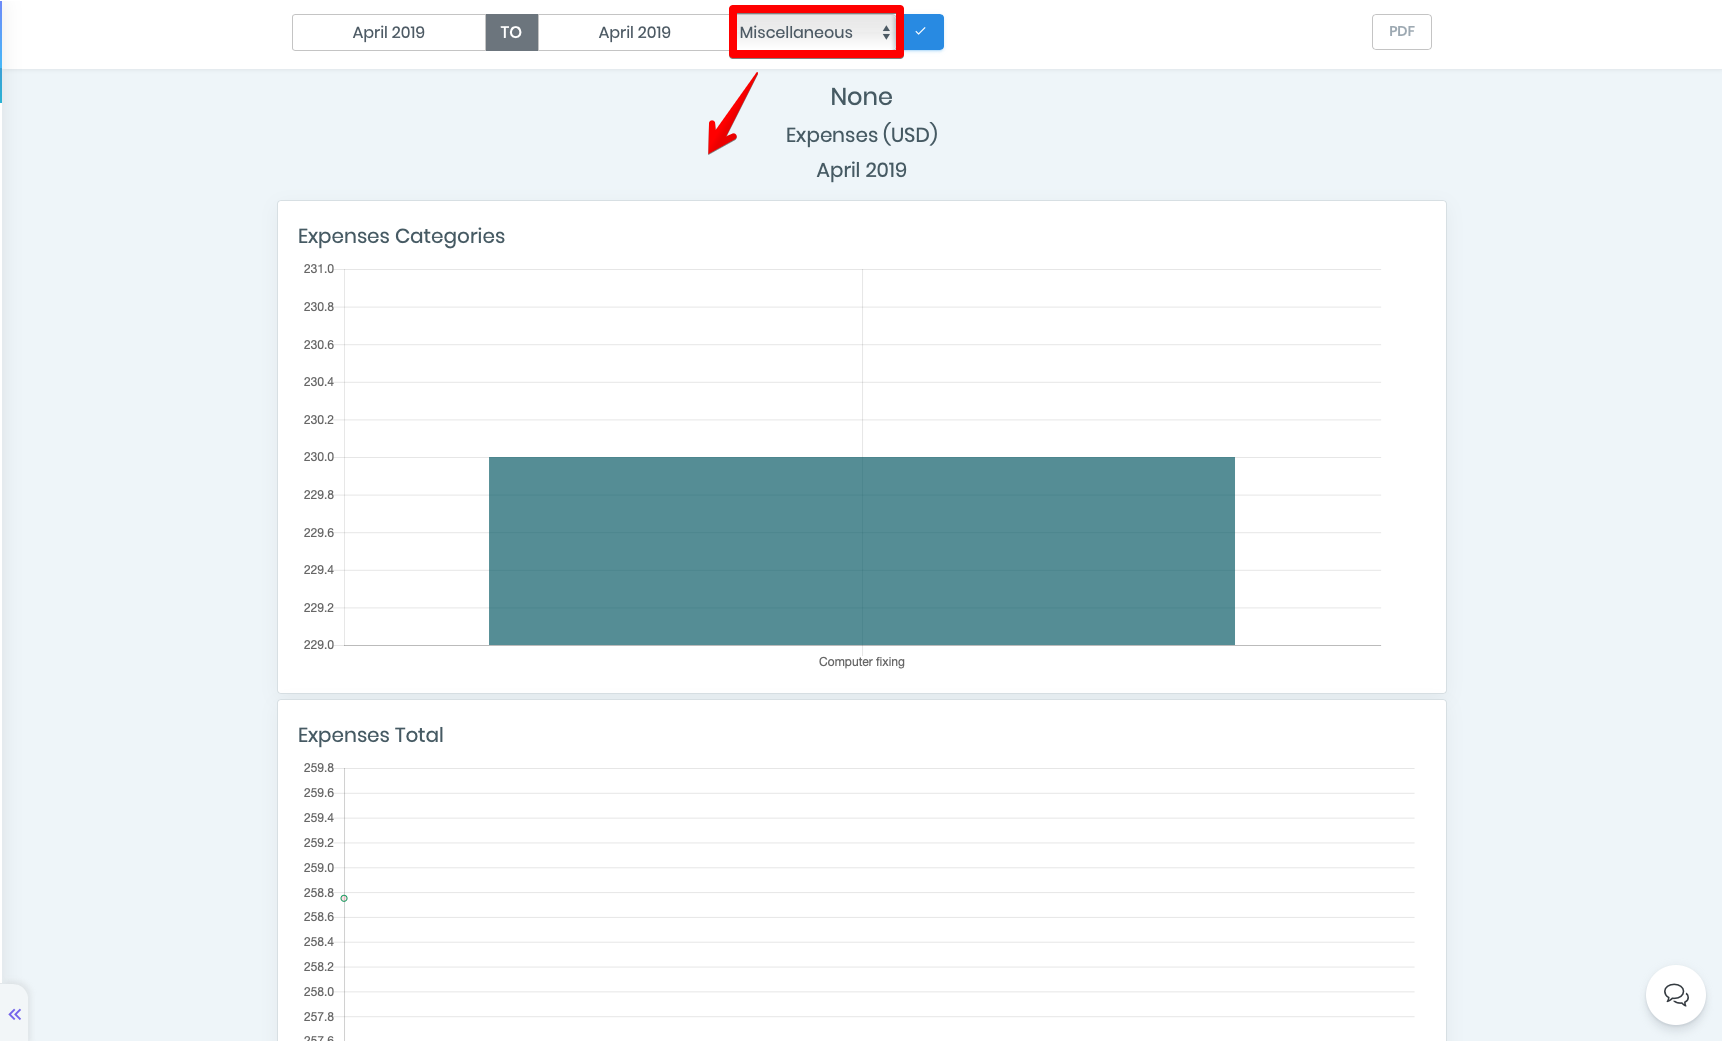
Miscellaneous filter
By selecting the Miscellaneous filter, you can only see data about other expenses. Tables and graphs are similar to the second option. Additionally, you can view the name of other expenses.